Introduction
An interactive learning tool for complex graph algorithms. The goal went beyond an academic requirement: I wanted to blend theory with practice and build something that teaches graph algorithms more effectively than static diagrams ever could.
The Inspiration
The project came from wanting to see theoretical concepts come to life. I led a team with diverse skills and backgrounds — not everyone was familiar with all the technologies involved — which made it a strong opportunity to combine technical leadership with hands-on development.
Challenges and Triumphs
The main challenges were handling large datasets, optimizing application performance, and integrating external services. The most satisfying win was designing a genuinely intuitive interface for an inherently complex application — each obstacle pushed me to apply familiar concepts in new ways.
Core Features
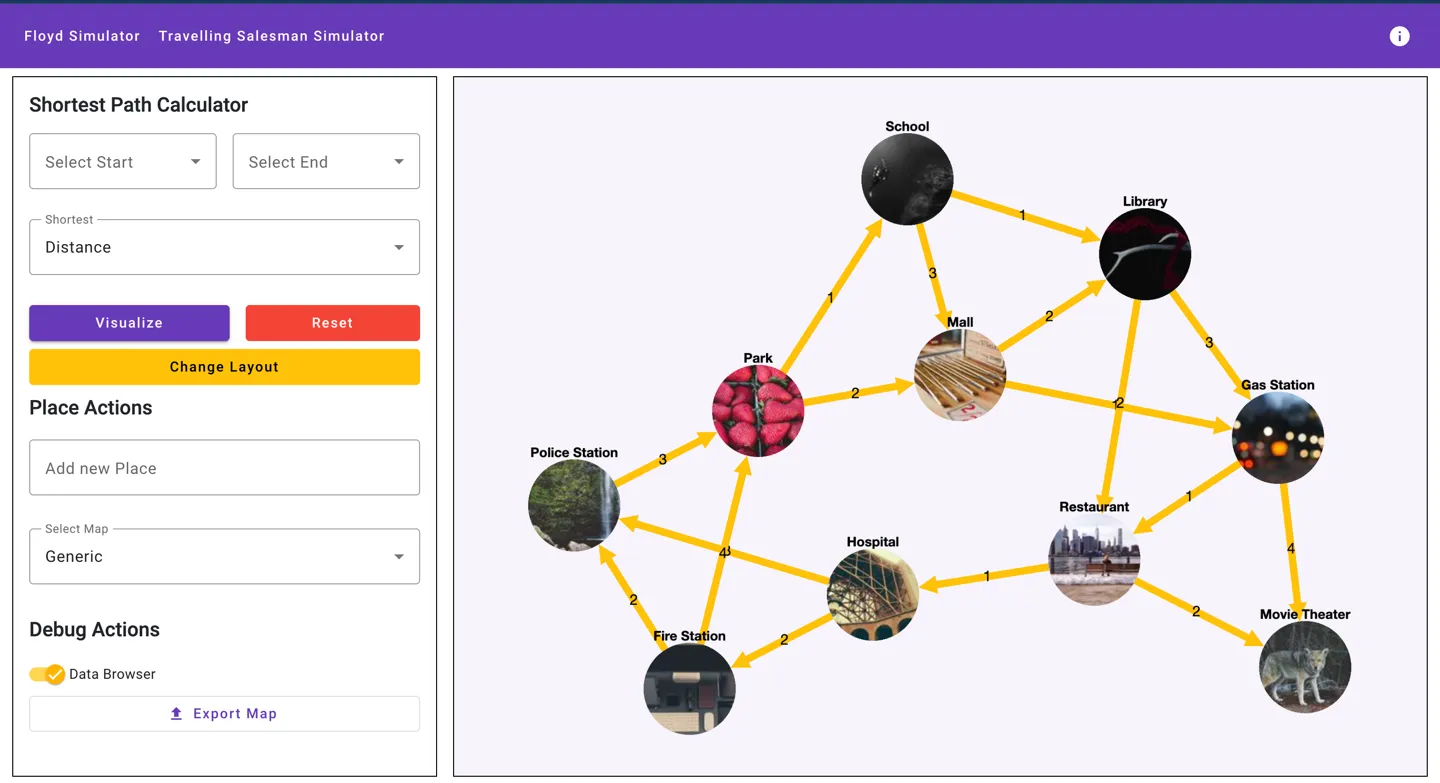
- Interactive graph visualization and manipulation with Cytoscape.js
- Floyd-Warshall algorithm for shortest-path finding
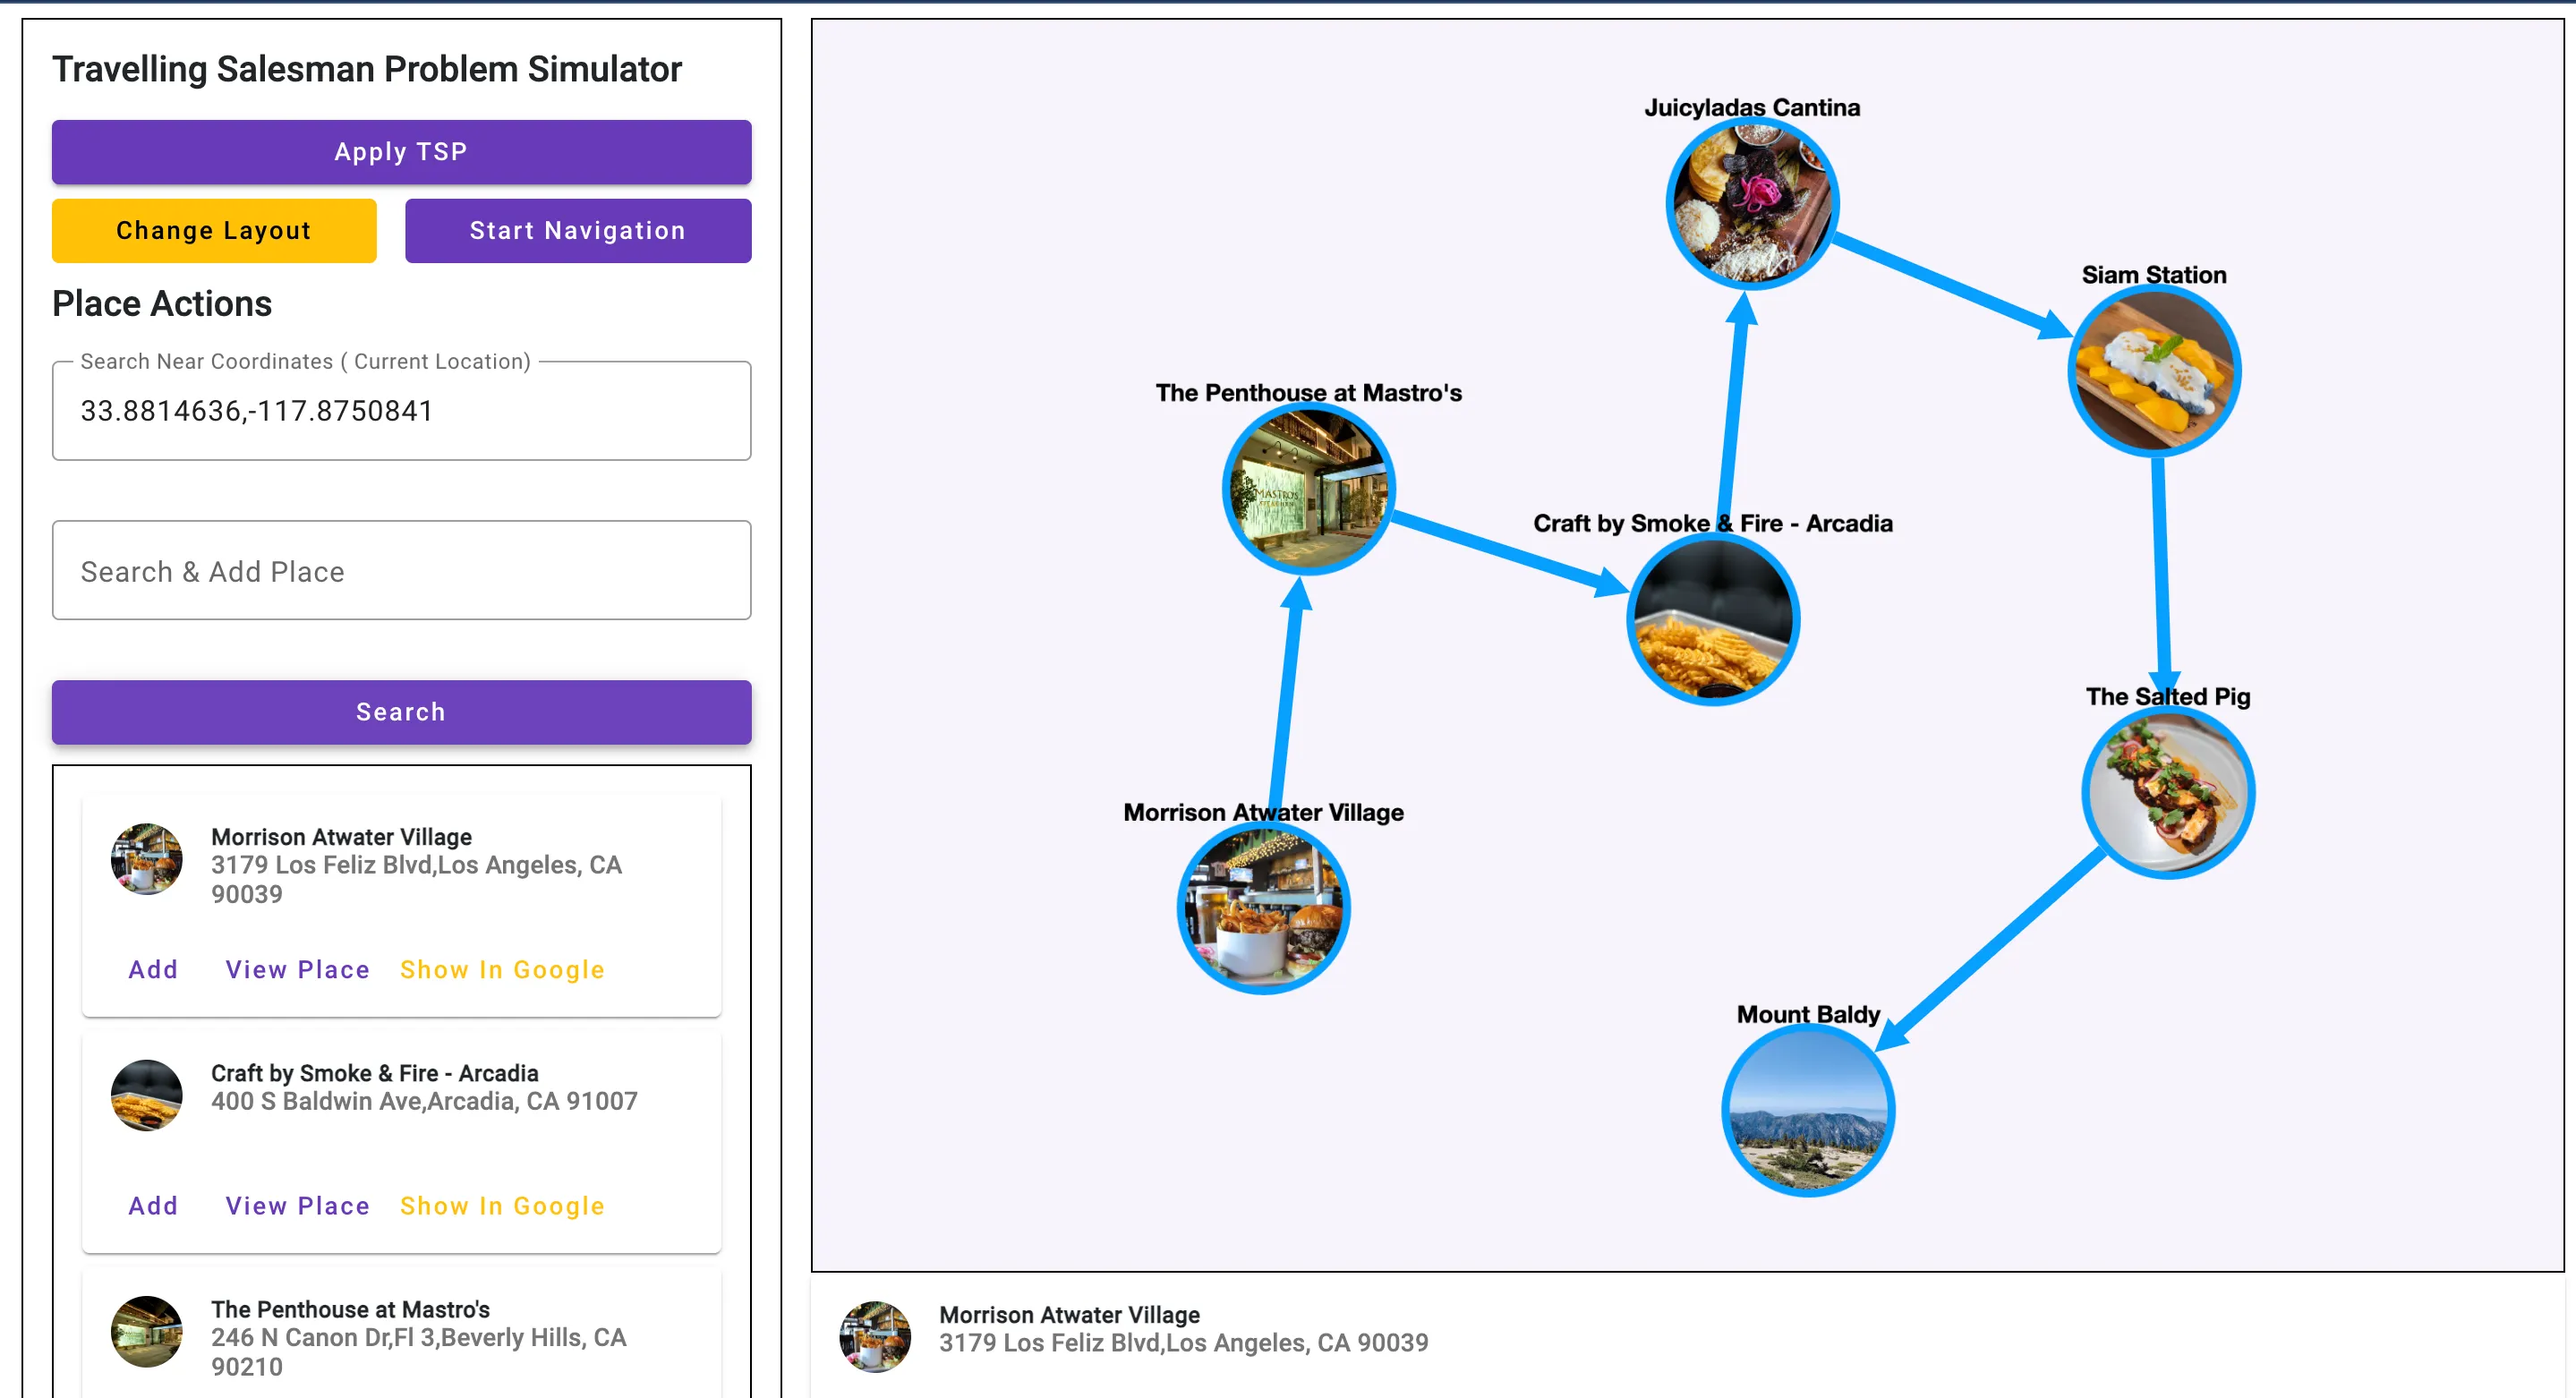
- Solving and visualizing the Travelling Salesman Problem (TSP)
- Dynamic graph editing (adding and removing nodes and edges)
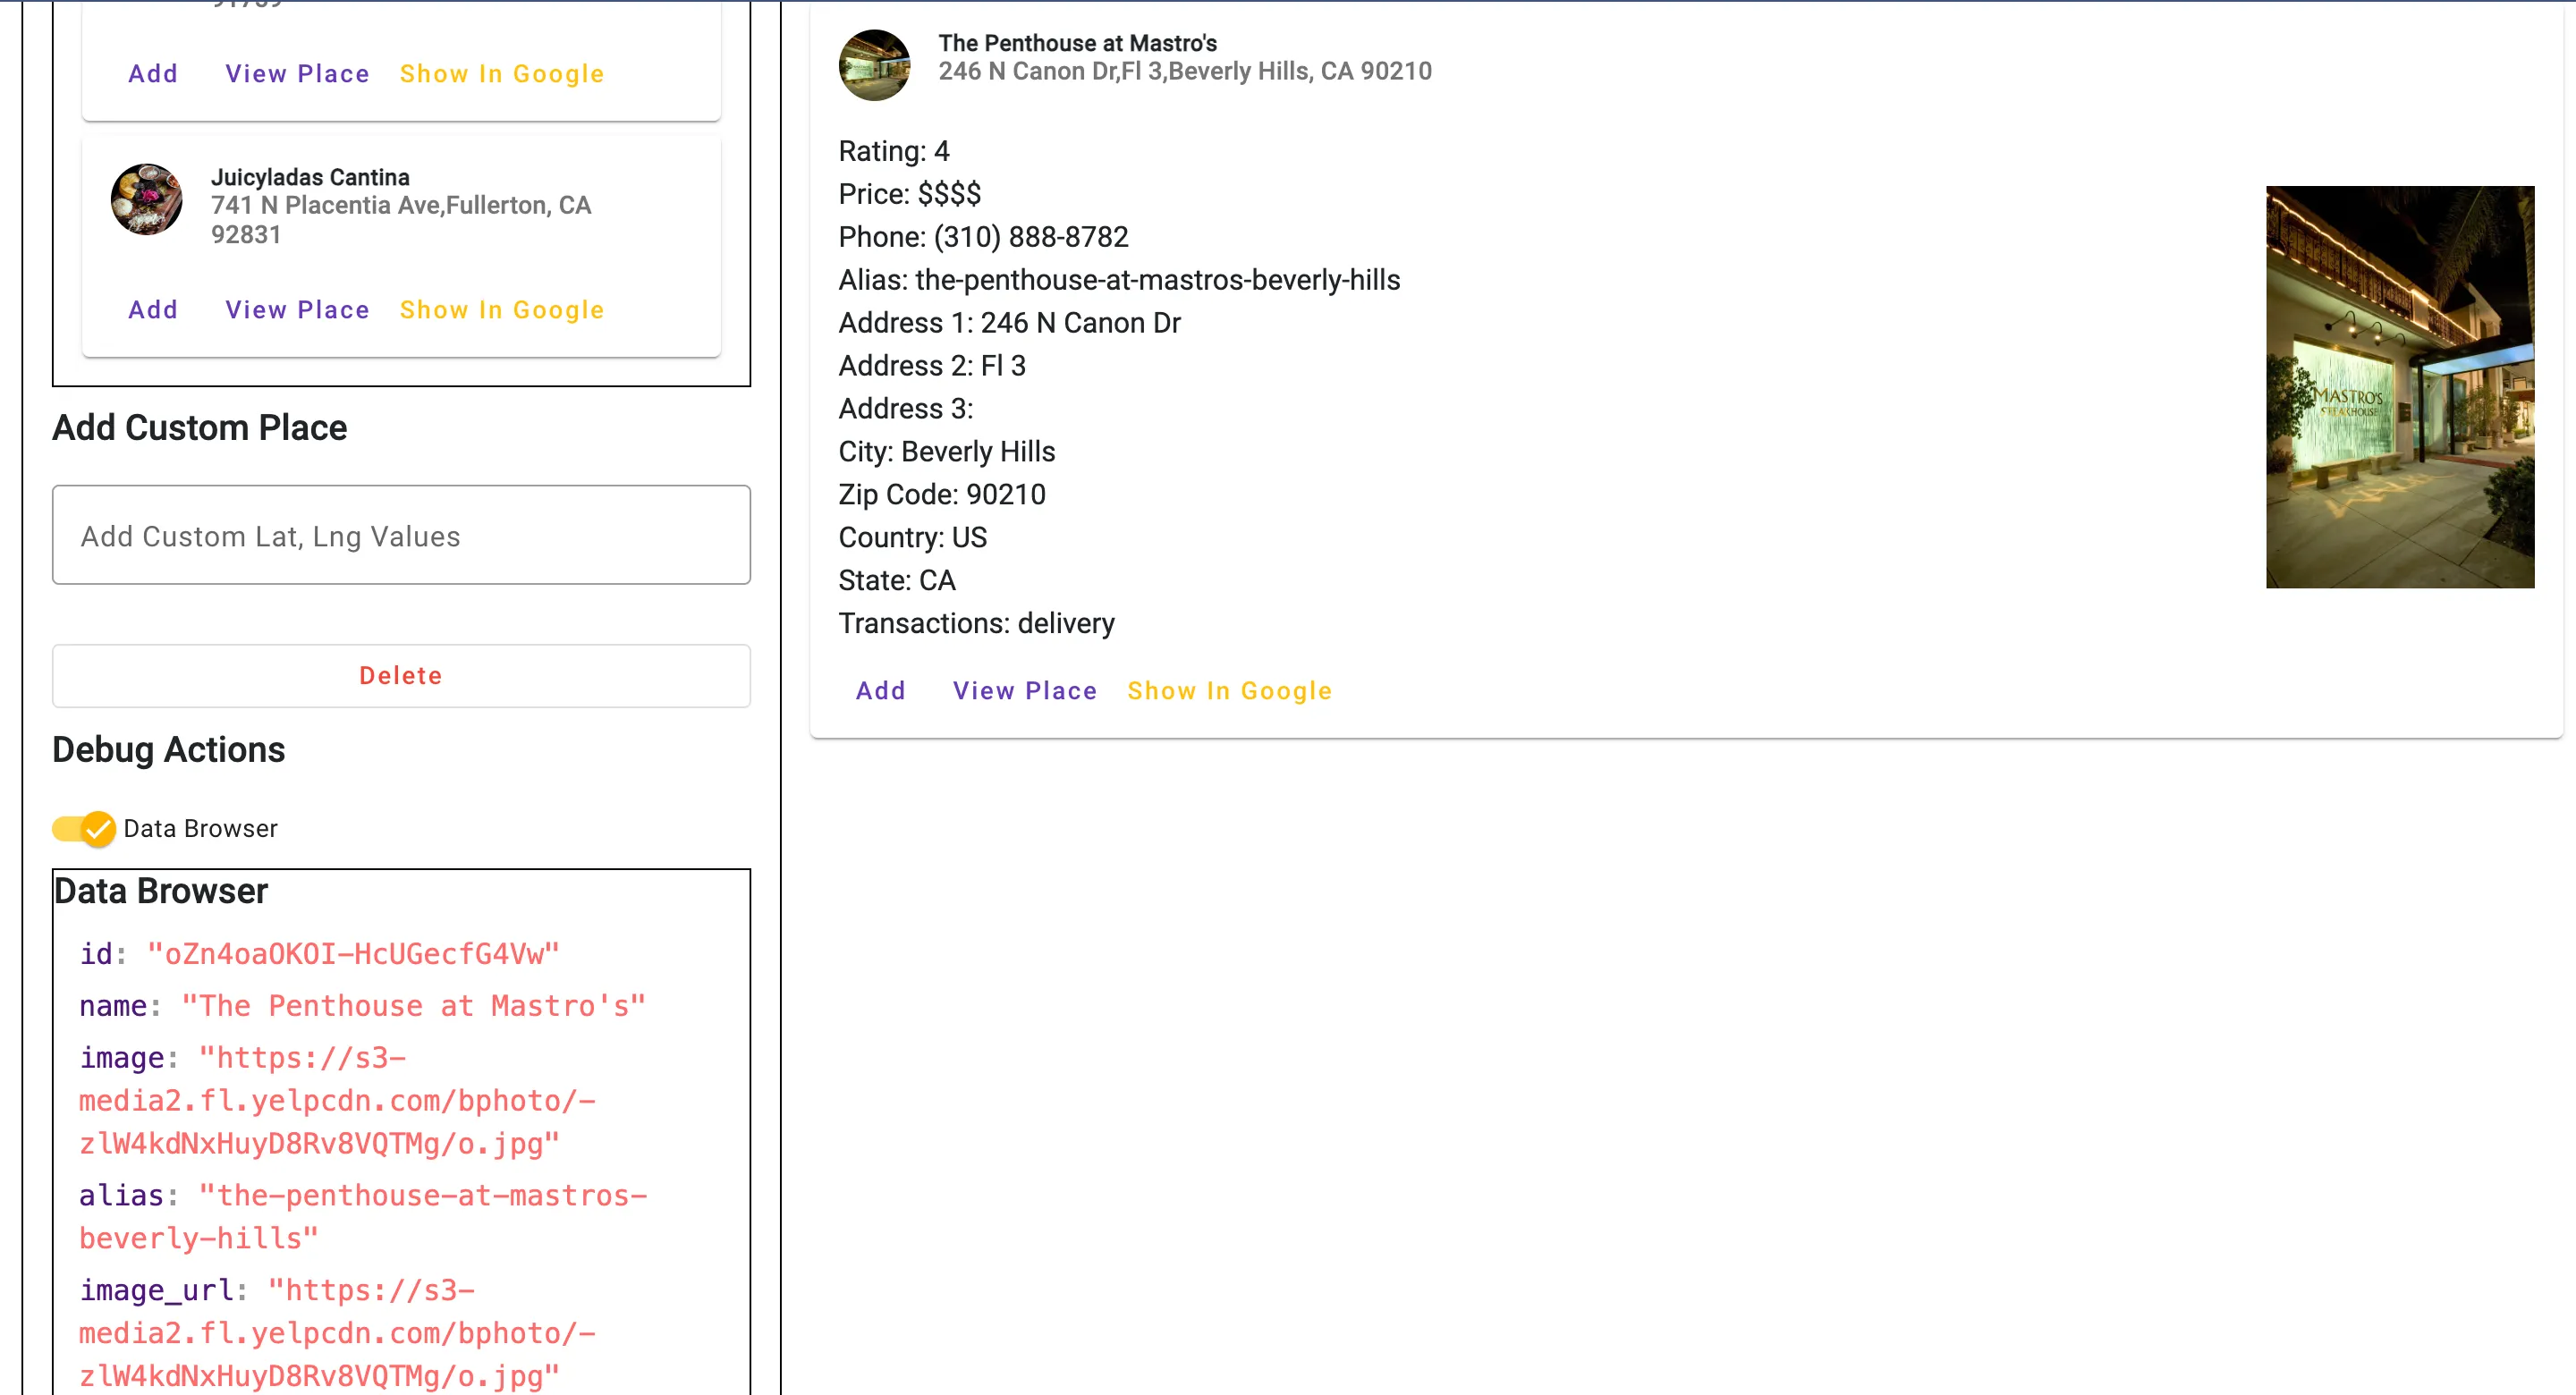
- Integration with external APIs for real data
- Importing and exporting graph data as JSON
- An intuitive interface for interacting with complex algorithms
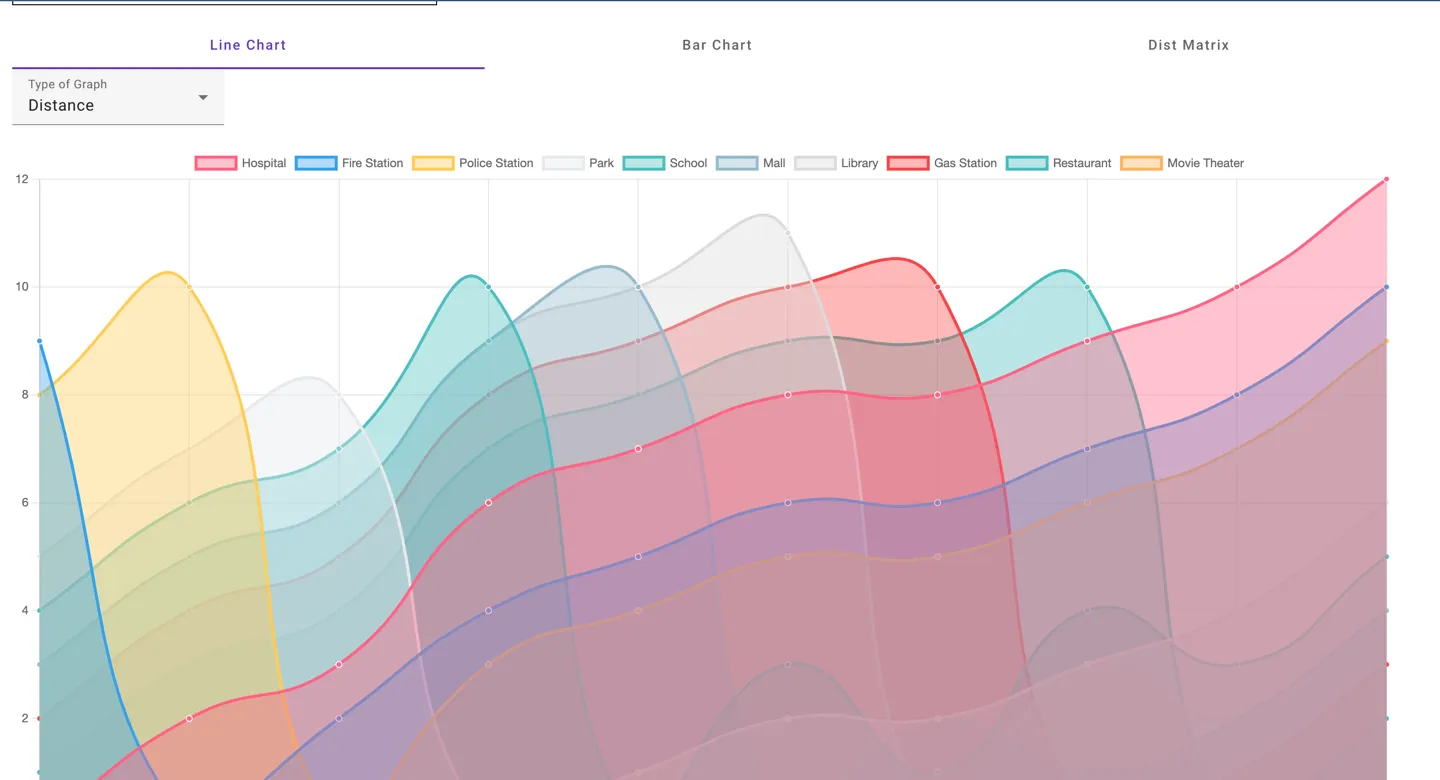
Screenshots
Floyd-Warshall Screens
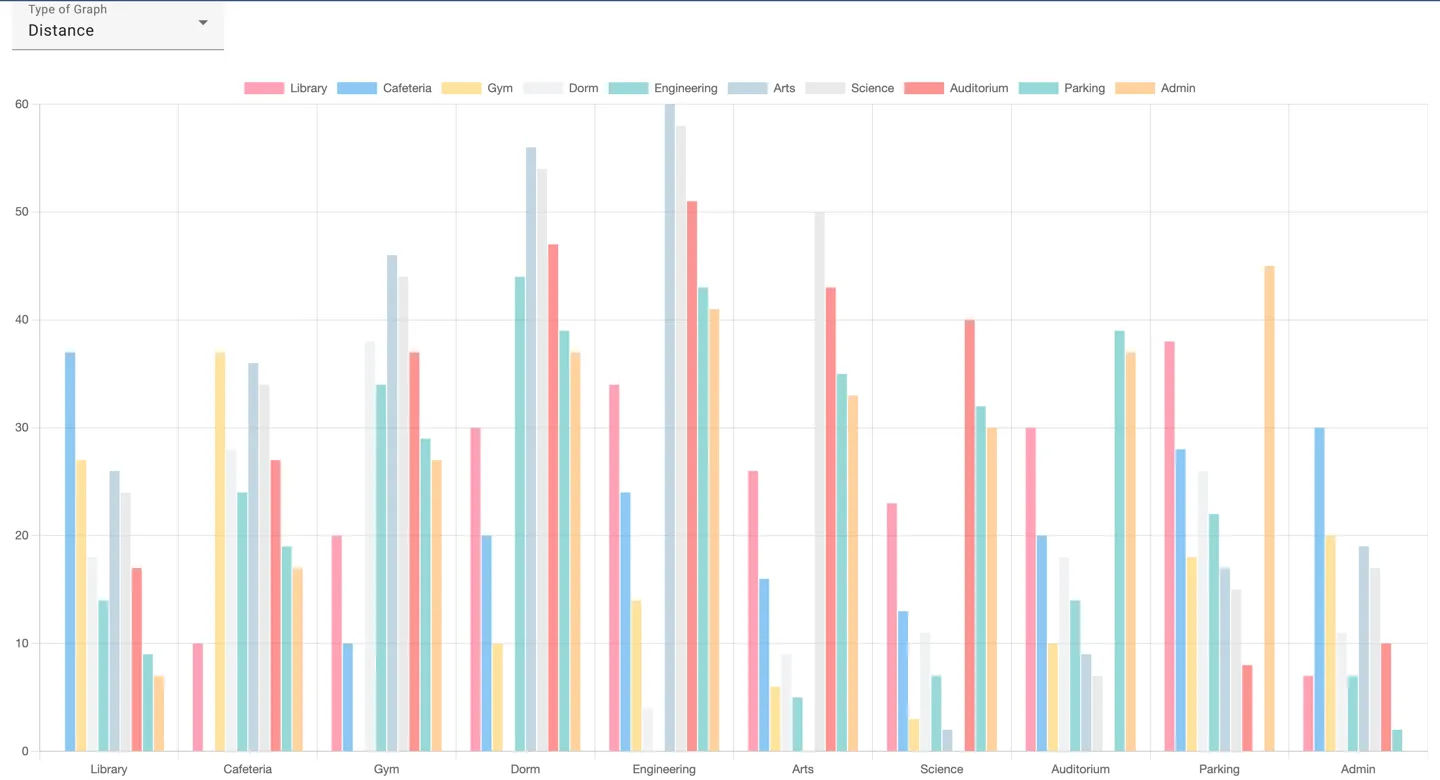
Travelling Salesman Problem Screens